Blog
Technician scheduling software in 2027: Essential capabilities for modern field service
What should technician scheduling software actually do? Nine essential capabilities, from skill matching and SLA priorities to real-time replanning, explainability, and API integration.
Technician scheduling software assigns field technicians to jobs and plans their days so that the right person, with the right skills, arrives within the promised window without wasting hours on the road.
The best tools do this automatically across hundreds or thousands of technicians, and they keep the plan valid as the day changes.
Most products in this category show a calendar and a map. The difference between them is what happens underneath: whether the software can weigh skills, time windows, SLAs, travel, and working-hour rules together, or whether it leaves those tradeoffs to a dispatcher.
This guide lists nine capabilities that separate modern technician scheduling from a digital whiteboard. It's written for operations leaders comparing tools and for product teams at field service software companies deciding what their own scheduling engine needs.
Why technician scheduling has become harder
Two pressures are pushing field service teams to rethink how they schedule.
- The first is labor. In the US HVAC trade alone, industry estimates put the technician shortage at around 110,000 open positions. When every skilled technician counts, a schedule that wastes an hour of their day on avoidable driving is a real capacity problem.
- The second is expectations. Customers expect narrow arrival windows, live updates, and a fix on the first visit. Nobody wants to be anticipating their technician coming in all day.
Both pressures land on the schedule.
Nine essential capabilities
1. Skill and certification matching
The software should know what each job requires and what each technician can do, including certifications, seniority, languages, and equipment access. Hard requirements (a gas-safe certificate) should never be violated. Softer preferences (a technician the customer has worked with before) should be encouraged but not forced.
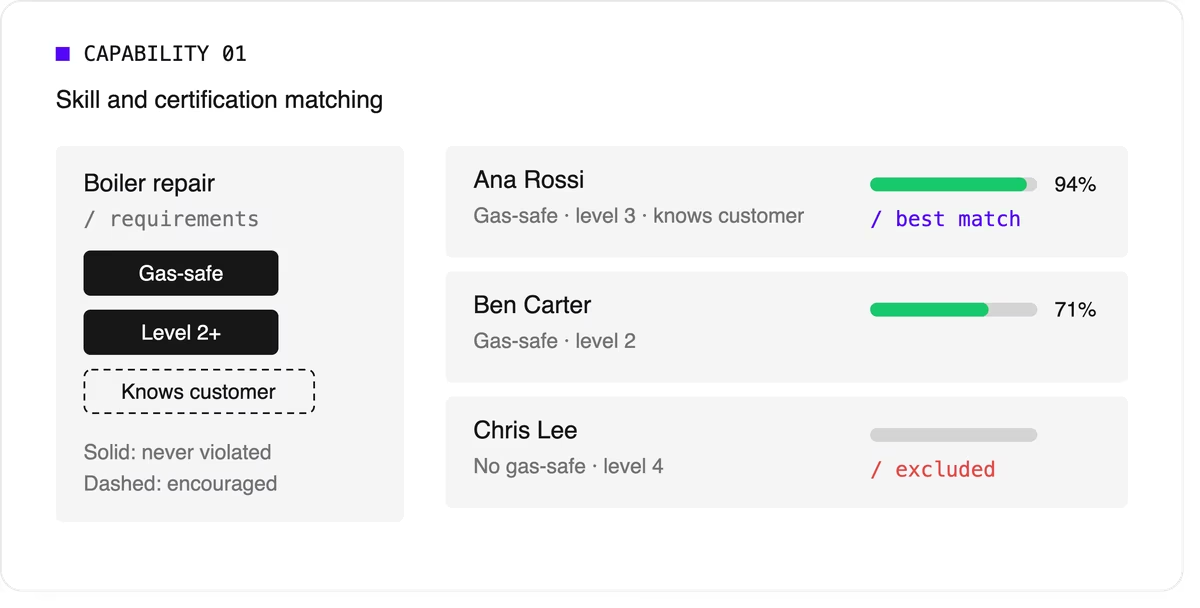
Look for support for skill levels and customer affinity in addition to simple yes-or-no skills. Matching the right skills is also one of the most direct ways to improve first-time fix rates.
2. Time windows and SLA priorities
Jobs come with customer availability windows, and many come with contractual deadlines.
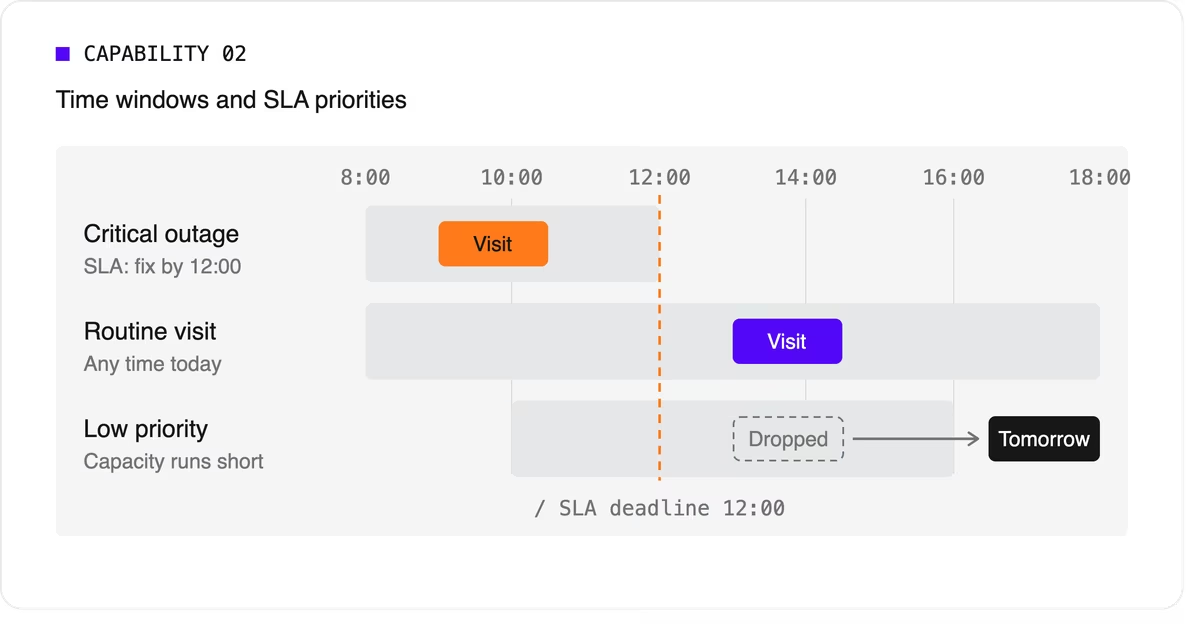
The software needs to treat a critical SLA differently from a routine visit that can move to tomorrow. That means supporting multiple time windows per job, priority levels, and deadlines that can push lower-priority work out of the plan when capacity runs short.
3. Travel-aware planning with real road data
A schedule that assumes straight-line distances will fall apart on the road. Technician scheduling software should use real travel times, ideally with support for traffic patterns and your own map provider if you already have one.
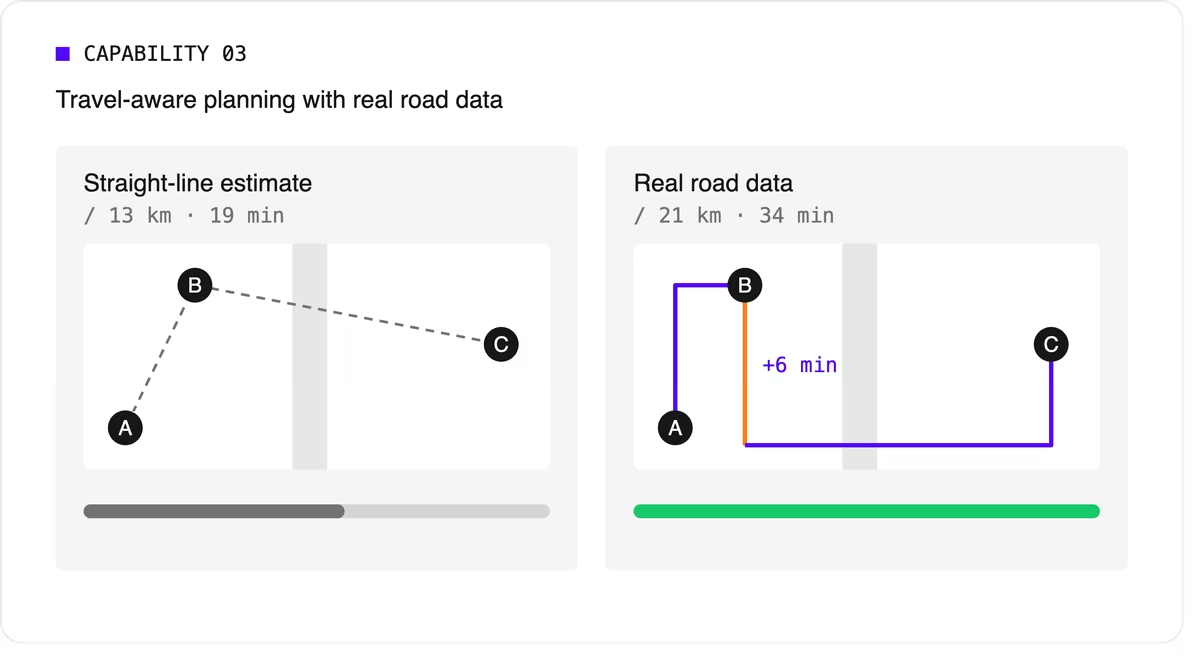
It should let you choose what to minimize, total travel time or total distance, because the two goals give different answers.
4. Multi-technician visits and job dependencies
Some jobs need two or more people on site at the same time for safety or lifting. Others must happen in order, sometimes with a delay: isolate the power before rewiring, or let a surface dry before painting.
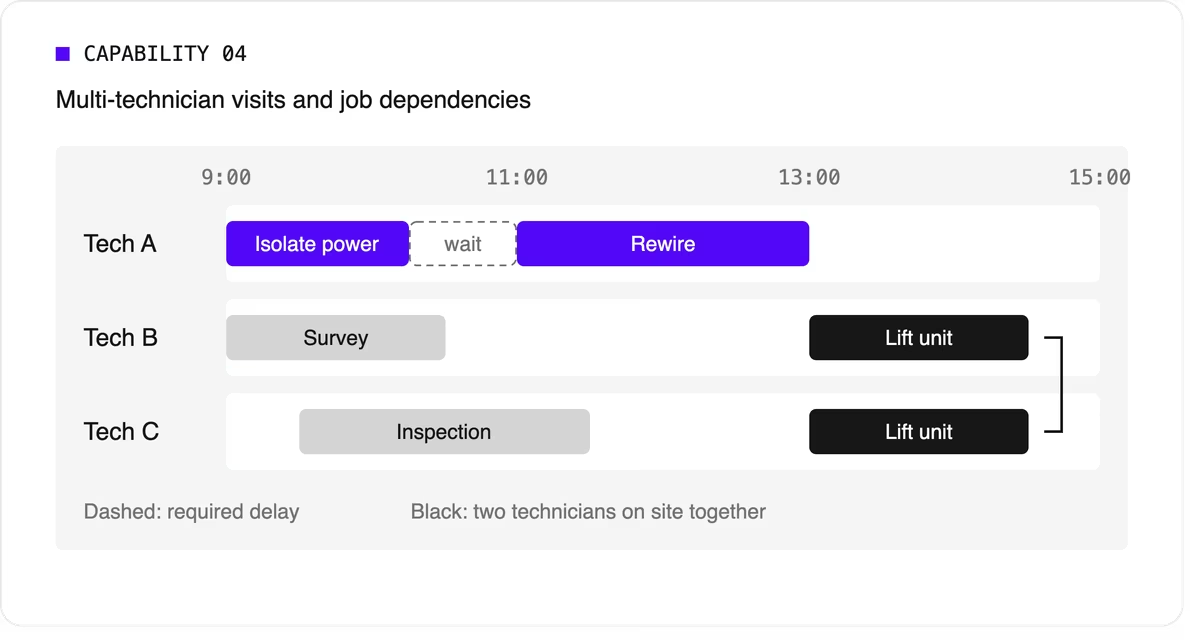
Many tools can't express these rules, so dispatchers track them by hand. If your operation has them, this capability is non-negotiable.
5. Working hours, breaks, and fairness
The plan has to respect shift start and end times, mandatory breaks, maximum working hours, and overtime rules. It should also spread work fairly so the same technicians don't always get the long days or the difficult jobs. Fairness affects retention, and retention matters more when technicians are hard to replace.
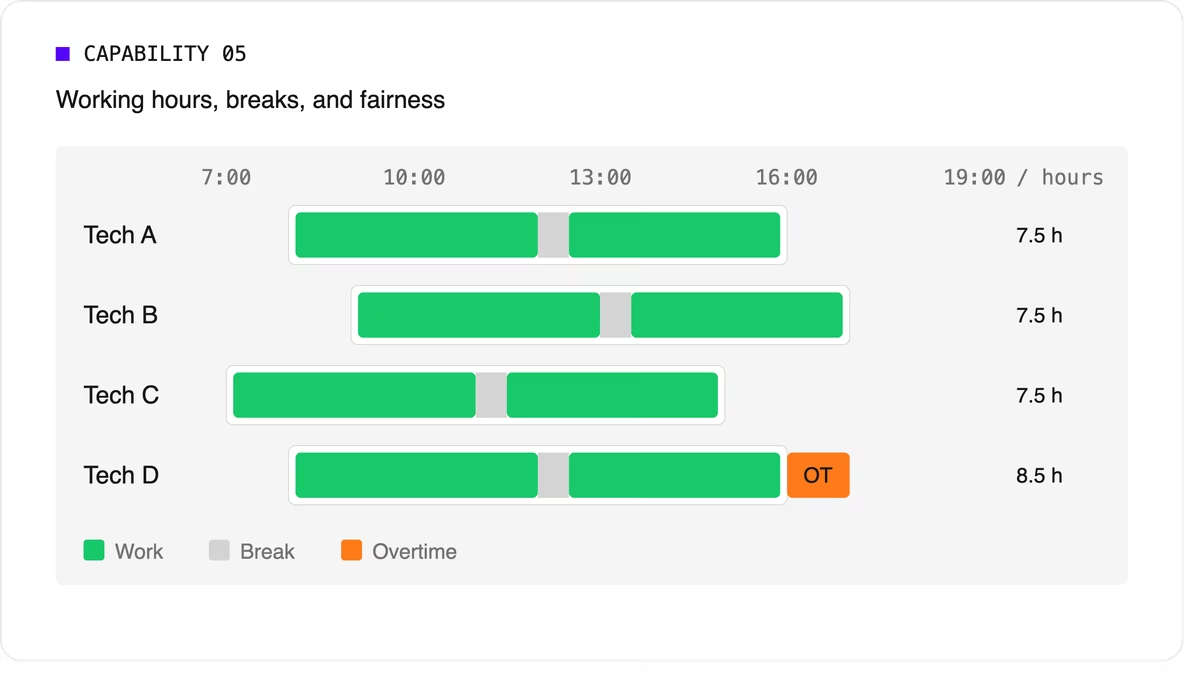
Scheduling software can support labor-law-style rules as constraints, but your organization remains responsible for verifying compliance with the regulations that apply to you.
6. Real-time replanning
Every schedule meets reality by mid-morning. A technician calls in sick, a job overruns, or an urgent call comes in. The software should replan quickly while changing as little as possible for everyone else. It should also let dispatchers lock (pin) jobs that are already in progress or confirmed with the customer.
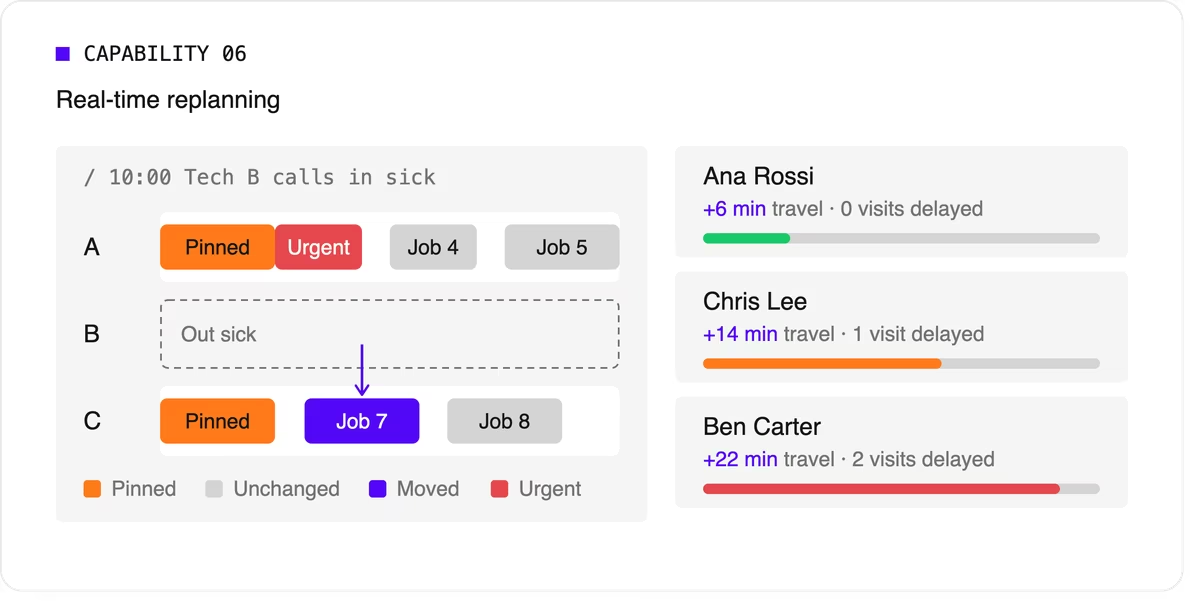
A strong version of this capability also recommends options. When a new urgent job arrives, the dispatcher should see which technicians could take it and what each choice would cost in travel or delayed work.
7. Explainability
Dispatchers and managers won't trust a plan they can't understand. Good technician scheduling software shows why a job was assigned the way it was, which rules were bent, and why some jobs couldn't be scheduled at all.
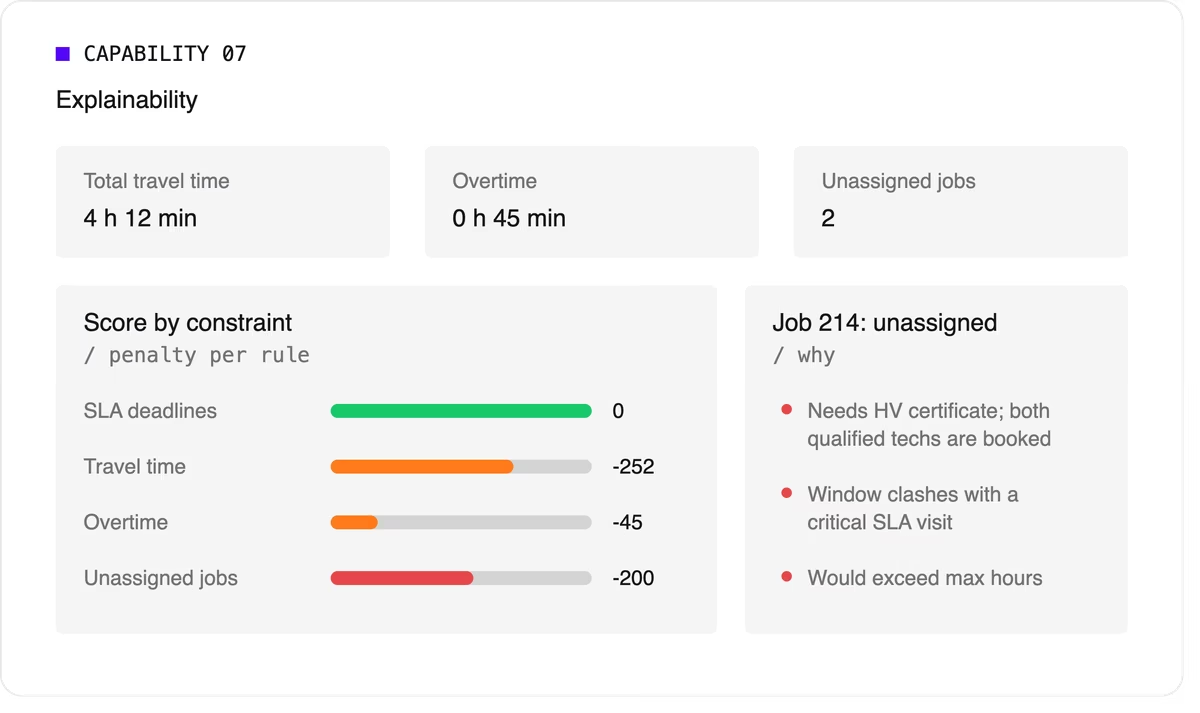
Look for a breakdown by constraint and clear metrics such as total travel time, overtime, and unassigned jobs.
8. Configurable priorities
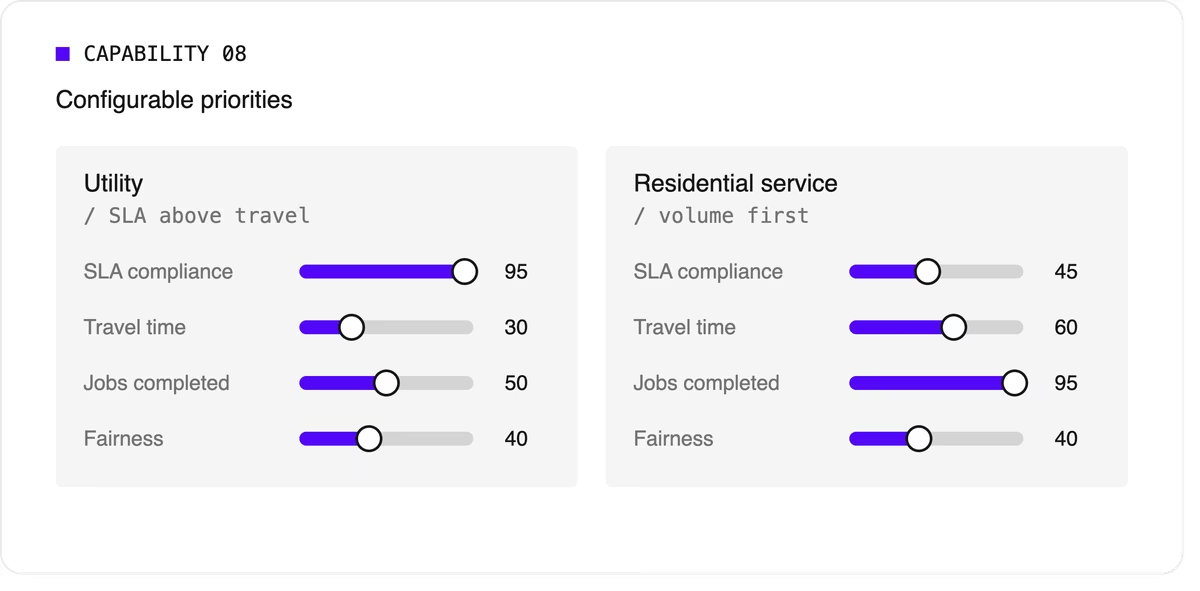
Every operation weighs its goals differently. A utility may put SLA compliance far above travel savings, while a residential service company may care most about completing as many jobs as possible per day. The software should let you adjust the relative weight of each goal without rewriting the underlying logic.
9. Integration and scale
Scheduling doesn't live on its own. It needs job data from your FSM or work order system, technician data from HR or workforce tools, and a way to push the finished plan to mobile apps. An API-first design makes this far easier than a closed tool with a separate interface.
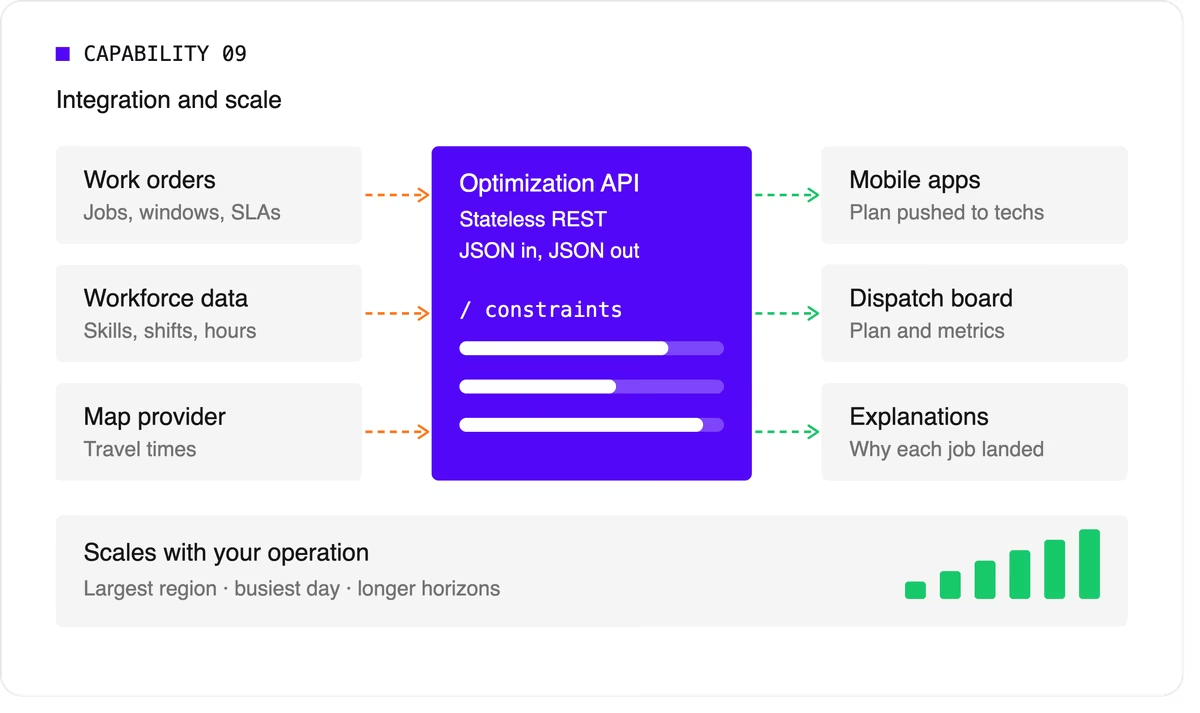
Scale matters too. The software should handle your largest region on your busiest day, and it should keep up as you add technicians, regions, or longer planning horizons.
A quick evaluation checklist
Use this table when comparing technicians scheduling software options or reviewing your own engine.
Scheduling software, FSM platform, or optimization engine?
When people search for technician scheduling software, they find three kinds of product.
- FSM platforms with a built-in scheduler cover the full workflow: work orders, mobile apps, invoicing, and scheduling. Their scheduling depth varies widely, from drag-and-drop boards to real optimization.
- Standalone scheduling tools focus on the dispatch board and often add basic auto-assignment. They're quick to adopt but can struggle with complex constraints.
- Optimization engines sit behind a user interface and do the heavy lifting. They don't manage work orders or invoices. Instead, they take in jobs, technicians, and rules, and return an optimized plan through an API. FSM vendors often embed one to strengthen their own scheduling, and large enterprises use one to add optimization to systems they already run.
Where Timefold fits
Timefold is an optimization engine in the third group. The Timefold Field Service Routing model covers the capabilities above: skill and seniority matching, customer time windows, visit dependencies with delays, multi-technician visits, working hours and fairness, and real-time replanning with recommendations. It ships with 50+ pre-configured constraints with adjustable weights, and every plan comes with metrics that show the tradeoffs it made.

It connects through a stateless REST API, so it fits alongside the FSM or work order system you already use. To see how this applies to field teams specifically, read about route optimization for field technicians. If you're preparing to integrate, the data foundations of efficient field service walks through the data you'll need.
FAQ
What does technician scheduling software do?
It assigns jobs to technicians and plans each technician's day, taking skills, time windows, travel, and working hours into account. More advanced tools optimize the whole plan at once and replan automatically when things change.
What's the difference between technician scheduling and dispatching?
Technician scheduling creates the plan ahead of time. Dispatching sends technicians to jobs and manages changes during the day. Modern software blends the two by replanning continuously.
Do I need technician scheduling software if I have an FSM platform?
It depends on how deep your FSM's scheduling goes. If dispatchers still spend hours adjusting assignments by hand, or your FSM can't express rules like dependencies or multi-technician visits, an optimization engine behind your FSM can close the gap.
How many technicians do I need before scheduling software is worth it?
There's no fixed number. Complexity matters more than headcount. A team of 20 with several skill types, tight SLAs, and multi-technician jobs can benefit as much as a team of 200 with simple, uniform work.


7 ways to fail your optimization project
When you put your optimization project into production, your enterprise will decrease expenses, increase customer satisfaction, improve employee happiness and/or reduce its ecological footprint. But if the end-users reject your implementation, none of that will happen. Let’s take a look why they might do that.
There are 7 common ways to fail your optimization project:
- Ignore the user’s plan
- Neglect a hard constraint
- Decide all score weights up front
- Change tentative plans drastically
- Presume there is always a feasible plan
- Average out fairness or load balancing
- Focus on only 1 stakeholder
Let’s take a look at each one in detail and the 7 ways to make your project a success:
1. Keep the user in control
Initially, nobody trusts a new system that takes input (the planning problem) and produces output (the solution) through a non-obvious transformation. To build this trust, allow the user to override OptaPlanner’s choices.
For example in Cloud Balancing, if the user locks the green process to computer Y, the planning engine must respect that:
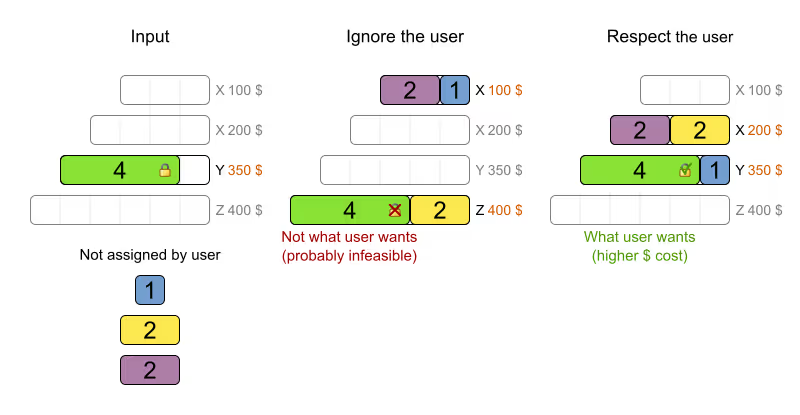
It’s not an all-or-nothing situation: the user and OptaPlanner (now continued as Timefold) work together (and the user is in charge). For a detailed use case, see this blog with video.
Technically, this is implemented through immovable planning entities: a simple boolean method that checks if the process is pinned.
2. Implement all hard constraints
An optimal solution that takes only 99% of the hard constraints into account is 100% useless. So implement all hard constraints.
For example in Vehicle Routing, let’s suppose we need to pickup nuclear cargo too, but forget to add a hard constraint to pick those up with a special vehicle:
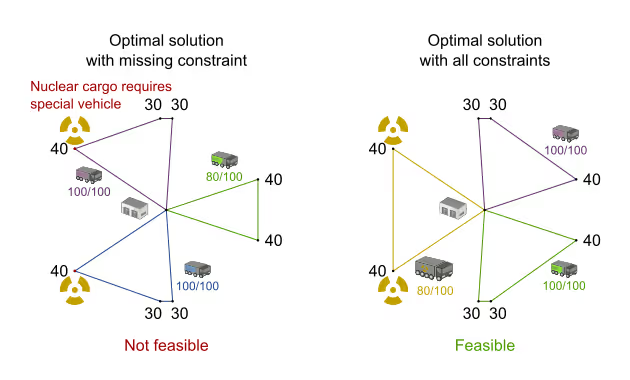
As you can see, taking that extra hard constraint into account can change the optimal solution entirely.
Technically, OptaPlanner supports any type of constraint: unlike other solvers, it doesn’t care if the constraint is linear, quadratic or worse. As long as it can compare the score of any 2 solutions, it finds the best one. That enables you to implement all constraints: none will be out of reach.
3. Don’t hard-code the score weights
Most business people can’t tell us the best score weights until they’ve seen the impact of those weights on their schedule. So allow the user to change the score weights at runtime and quickly see the effect of his/her changes on the solution.
For example in Cloud Balancing: should we focus on load balancing or on cost reduction?
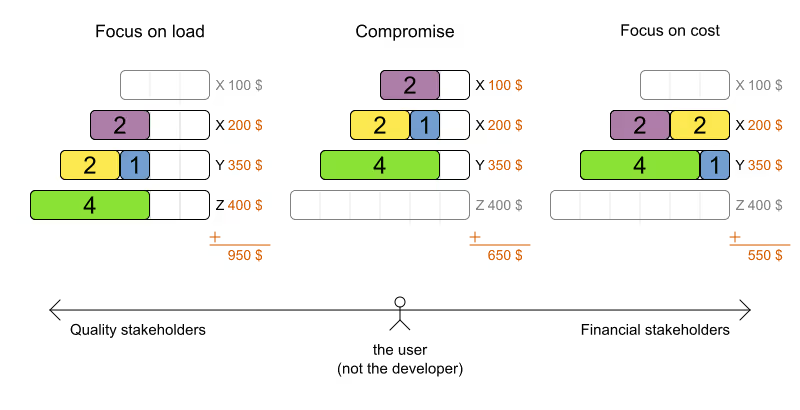
Some constraints work together, others work against each other. Especially for that last kind (as shown above), different stakeholders within the same enterprise can disagree on the score weights. Empower the project owner to settle those negotiations by directly changing the weights in the UI.
Technically, simply add a singleton with the score weights in the dataset and use those weights in the constraints. Look for a *ConstraintConfiguration class in some of the OptaPlanner examples.
4. Avoid disruption when replanning
At some point, a plan becomes tentative or even final. Any changes after that point can be very disruptive to anyone involved in that plan. But ad hoc changes, such as an employee calling in sick or malfunctioning equipment, will make your plan infeasible and force you to replan it.
For example in Cloud Balancing, a computer might break down:
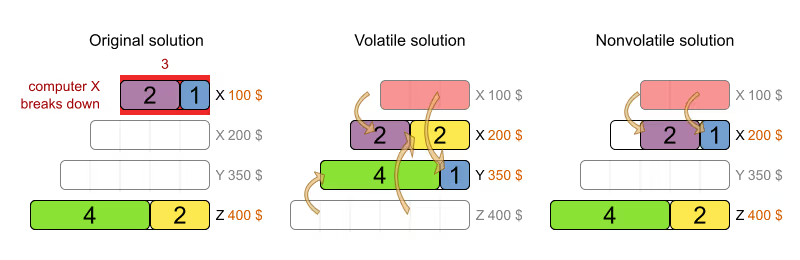
The middle solution is slightly more cost-effective, but the last solution is far less disruptive. Especially when scheduling people, who planned their social life based on the tentative schedule, it’s important to minimize disruption.
Technically, we penalize the number of processes that moved, by keeping track of the old tentative computer assignment for each process too.
Another way to make this easier is to also do backup planning. For example in employee rostering, we assign 3 reserve shifts as backups to 3 employees: if another employee calls in sick, one of the reserve employees takes over automatically, without replanning. Only when more than 3 employees call in sick, we actually need to do (non disruptive) replanning.
5. Account for overconstrained planning
It can happen that there aren’t enough resources to solve a planning problem without breaking a hard constraint. In that case, instead of delivering an infeasible plan, it’s often better to leave some entities unassigned (as little as possible of course).
For example in employee rostering, when we need to assign 4 late shifts on the same day and we only have 3 employees, it’s better to leave 1 shift unassigned than to assign an employee to 2 shifts at the same time.
Going one step further, we can add virtual resources to indicate how many extra resources to buy/hire. For example in the same employee rostering case, we could add 2 virtual employees. After solving, it will use one of these which tell us that we can make the schedule feasible again by hiring 1 extra employee.
Technically, we need to treat unassigned (or virtual assigned) entities differently in the constraints and add a medium score level (between hard and soft) to penalize the number of unassigned (or virtual assigned) entities.
6. Be fair (load balancing)
When distributing work across humans (or machines), don’t use averages. Instead, the worst off human (or machine) counts the most.
For example in employee rostering we want to distribute the shifts evenly, but we can’t make it perfectly fair due to skill and other hard constraints. It’s not about minimizing overtime on average, but about minimizing overtime of the worst off employee:
In the last solution, more employees are happy, but the worst employee is worse off, so it’s less fair than the middle solution.
Technically: penalize the square of the number of shifts per employee.
7. Create a win-win for all stakeholders
In a big organization, many different groups will want to tune the constraint weights in their favor. For example: management will often want to maximize cost reduction, but unions will want to maximize employee happiness and job security. Whenever possible, aim for a solution that improves the status quo for all stakeholders. They can always negotiate the tuning of the score weights later.
In a war story that came to my ear, I’ve heard about a VRP case for inspectors that heavily reduced driving time to inspection sites, allowing the same work to be done in less time. Because the prototype focused only on using fewer inspectors, the unions shot it down. If instead the prototype had focused on increasing inspection time, it would have increased inspection quality, reduced worker stress, lowered fuel expenses and decreased the need for new hires. That’s far more acceptable to all stakeholders.
Conclusion
Project success doesn’t depend on solution quality alone. There are a lot of factors that can make or break a project. In this article I highlighted some of the more social ones. Luckily, you can handle these additional requirements with OptaPlanner (now continued as Timefold) too. Don’t let them catch you off guard!
How good are human planners?
Are we smarter than machines when it comes to planning? Or can automated planning beat humans? I did an experiment with a group of innocent software engineers. These are the results.
Methodology
During my last 2 deep dive trainings, I asked the attendees to manually solve a simple planning problem, to introduce them to the difficulty of planning optimization.
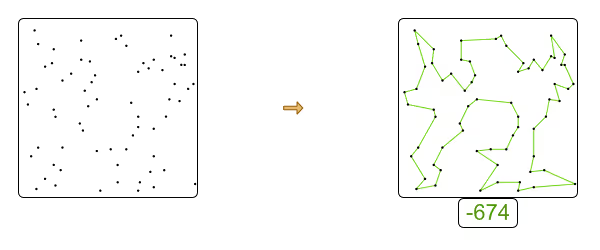
I gave them a Traveling Salesman Problem (TSP) and asked them to connect the dots to find the shortest tour possible:
They laughed. Isn’t this a kids game? Yes, except that the dots are not numbered and you’re not looking for Mickey Mouse.
Calculating a trip’s distance on paper is not practical, so they recreated their trips in the TSP example in OptaPlanner examples (only since 6.3.0.Beta1) to calculate the distance automatically. You can try this assignment yourself: right-click in the example’s UI to manually create a trip.
Their first attempt and their best attempt in a time window of almost 30 minutes was recorded. This is the optimal solution that we hoped to find:
Results
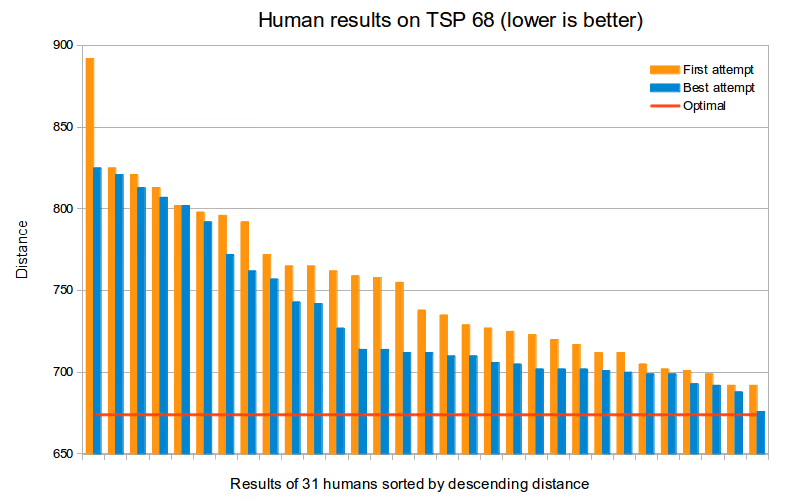
No one found the optimal solution. Most people didn’t even find a near optimal solution (including me):
First attemptBest attemptOptimal674674Average human752732Average human worse than optimal12%9%
On average, a human’s best result was 9% worse than the optimal solution. That means it roughly takes 9% more time and 9% more fuel to visit those locations. That’s expensive.
That’s just on a small problem with only 1 constraint! In the real world, other constraints need to be taken into account, such as vehicle capacity, real road networks and custom business constraints. All of these make it harder.
Below are the individual results:
First attemptBest attempt825825821821813813892807802802792792772772762762798757765743758742727727765714755714712712712712729710759710723706705705796702738702702702720701725700717699699699701693692692735688692676
The best attempt of the best human was only 0.3% worse than optimal. That’s a very nice result. If I recall correctly, he did take longer than 30 minutes to find it. Was this skill or luck (or a combination of both)? The second best human (out of 31 people) was 2% worse than optimal.
With automated planning, such as OptaPlanner (now continued as Timefold Solver), we can beat the human results, in far less time. We can also scale to bigger datasets with more constraints. Does this mean we can get rid of the human planner?
Do we need a human planner?
We still need a human planner: not to search for the best plan, but to define what to search for. A search engine like Google can search the web, but it needs to be told what to look for. Similarly, any automated solver (including Timefold Solver) can optimize a planning, but it needs to be told what to optimize for.
In a non-trivial enterprise, defining what the business wants/needs to optimize, is not a simple task. It involves talking to the business departments and iteratively tweaking those constraints. We still need a human to that. And as the business changes (market changes, labor regulations changes, …) those constraints will change too. Again, we need a human to watch over the planner. We also need someone to input the data and validate the results. Furthermore, the human needs to stay in control.
But ask yourself: Who of these 2 contenders will win a knowledge quiz?
- The smartest person on the planet
- An average graduate with internet and Wikipedia access
Similarly, who do you want to optimize the planning in your organization? Someone with or without automated planning assistance?
3 Bugs in The Ultimate American Road Trip of The Washington Post
Earlier this week, The Washington Post published an article about how a data genius has computed the ultimate American road trip. The only problem… it contains several mistakes! It’s not the optimal route, nor the shortest route, nor the fastest route. Let’s take a look at the problems and how we can fix each of them.
The goal
The Ultimate American Road Trip stops at 50 national natural landmarks, national historic sites and national monuments in the US. The goal is to find the fastest trip to visit all of these locations. This is known as a Traveling Salesman Problem.
The original solution (Olson’s algorithm)
Here’s the original solution based on Randy Olson’s blog shown with Google Maps:
Note that I had to recreate the datasets. I’ve used exact latitude longitude coordinates (instead of location names) to avoid ambiguity and get more accurate routes.
The Washington Post even claims that the trip above is the fastest trip (Olson’s blog doesn’t make this claim), but it’s not:
Bug 1: Better optimization algorithms give better results
A few days ago, William J. Cook already proved with Concorde that there’s a shortest and faster path near Iowa. With OptaPlanner (now continued as Timefold Solver) I come to the same conclusion:
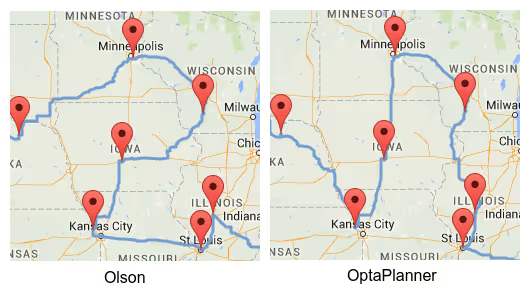
This reduces the total time by 1h 35m 40s and the total distance by 34km 515m.
Bug 2: Ghost driving (driving on the wrong side of the road) is illegal
Road distances are not symmetric. Driving from A to B is not the same as driving from B to A (if you adhere to traffic rules, of course):
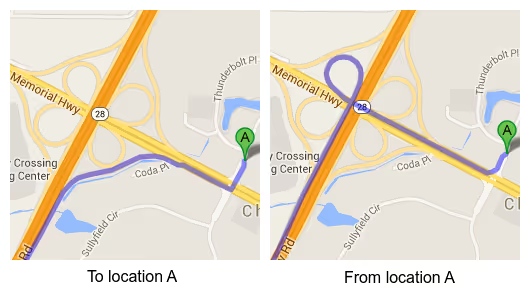
If we take this into account, the fastest path near Carolina changes:
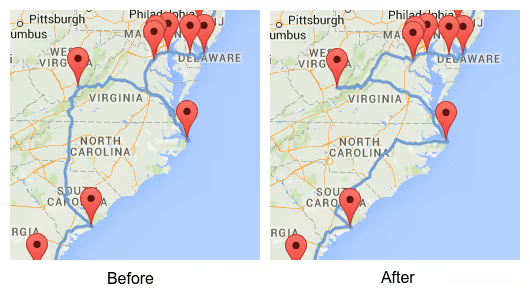
On the left is the path found by both Olson and Cook (and by myself when using Olson’s symmetrical distances). On the right is my path, which reduces the total time by another 49m 36s (if both paths are computed using asymmetric distances), but increases the distance by 805m.
Bug 3: Google Maps does not return the shortest routes
Do we want the shortest or the fastest trip? We used Google Maps to calculate the fastest route between every pair of locations. So if we’re aiming for the fastest trip, that’s fine.
However, if we’re aiming for the shortest trip, then we should be asking Google Maps for the shortest routes, which can be drastically different:
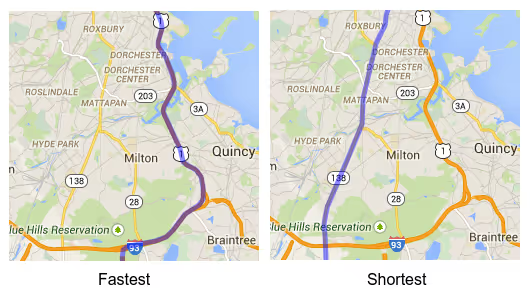
Contrary to popular belief, the shortest trip on the fastest routes is not the shortest trip.
Most people tend to prefer highways over dirt roads, so they prefer the fastest trip over the shortest trip. In more advanced use cases, we would also want to take additional constraints into account:
- Not all routes are equally beautiful or equally safe.
- Consider optional places to visit, as long as they don’t impact the length of our trip too much.
- Consider time constraints: to see that sunset at the ocean, we’ll need to arrive there before the evening.
That’s when a customizable solver such as Timefold Solver becomes really useful.
Conclusion
By using better algorithms and a more accurate model (without ghost driving), our trip is 2h 25m 16s faster:
DatasetTimeTotal time gainDistanceTotal distance gainOlson (Clockwise)232h 43m 10s 22'602km 201m Iowa fix (Clockwise)231h 7m 30s1h 35m 40s22'567km 686m34km 515mIowa and Carolina fix (Clockwise)230h 17m 54s (best)2h 25m 16s22'568km 491m33km 710m
Interestingly enough, if we’re looking for the shortest trip (and we ignore bug 3 because we prefer highways), we notice that the same trip (with both fixes) in the reverse direction is the shortest:
DatasetTimeTotal time gainDistanceTotal distance gainOlson (Counterclockwise)232h 46m 58s 22'612km 070m Iowa fix (Counterclockwise)231h 16m 52s1h 30m 06s22'562km 668m49km 402mIowa and Carolina fix (Counterclockwise)230h 27m 26s2h 19m 32s22'560km 688m (best)51km 382m
This is my solution to the Ultimate American Road Trip (with those fixes):
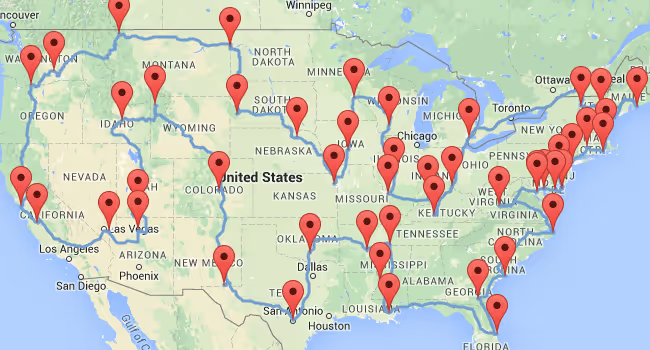
Drive it clockwise to optimize time!
Visualizing Vehicle Routing with Leaflet and Google Maps
After OptaPlanner (now Timefold) finds the best solution for a Vehicle Routing Problem, users usually want to see it on a real map, such as Google Maps or OpenStreetMap. The optaplanner-webexamples.war for OptaPlanner 6.3 now demonstrates that.
Visualization
In the case below, I’ve solved a VRP problem with 50 locations and 8 vehicles and projected the best solution with Leaflet and Google Maps. It’s a case of capacitated vehicle routing: each vehicle can carry 100 items and each location needs a number of items picked up.
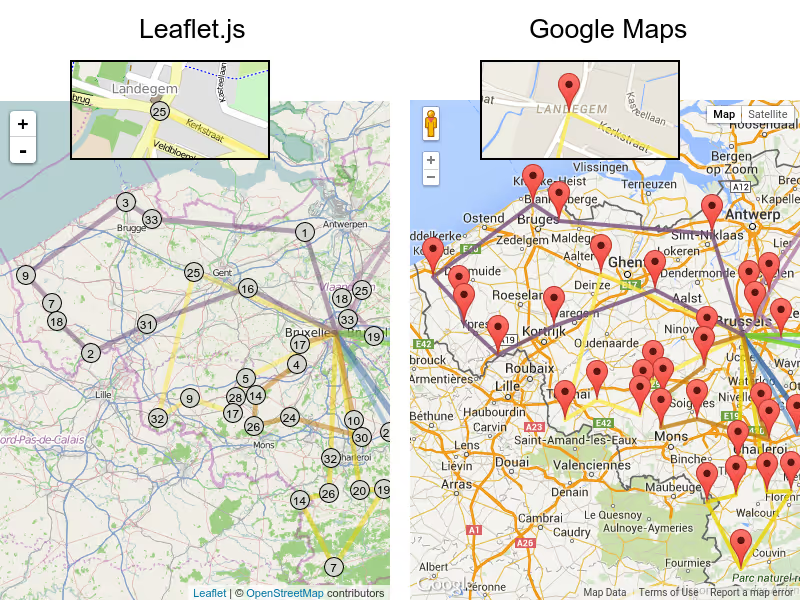
Despite that the lines are shown as straight between locations, actual road distances were used in the optimization calculations. In total, the vehicles drive a little under 32 hours, so on average 4 hours per vehicle (includes location service time). This solution doesn’t take into account rush hour yet, but if such traffic prediction data were available, we can make OptaPlanner apply that too, which could result in a different best solution.
In the web UI, we can zoom in on a specific location, such as the Landegem town center, where we need to pickup 25 items. In this solution, those items are picked up by the yellow vehicle.
The visualization was implemented in 2 different ways:
Leaflet.js
Leaflet.js is an open source JavaScript that uses OpenStreetMap data.
Google Maps
Google Maps is a proprietary JavaScript that uses Google data.
Apply it now in your case
If you’re using the latest OptaPlanner final release (6.2.0.Final at the time of writing), you easily do such visualization too: those webexamples don’t require any APIs new in optaplanner-core 6.3, so download the nightly snapshot and look for webexamples/sources to see how it’s done.
Update
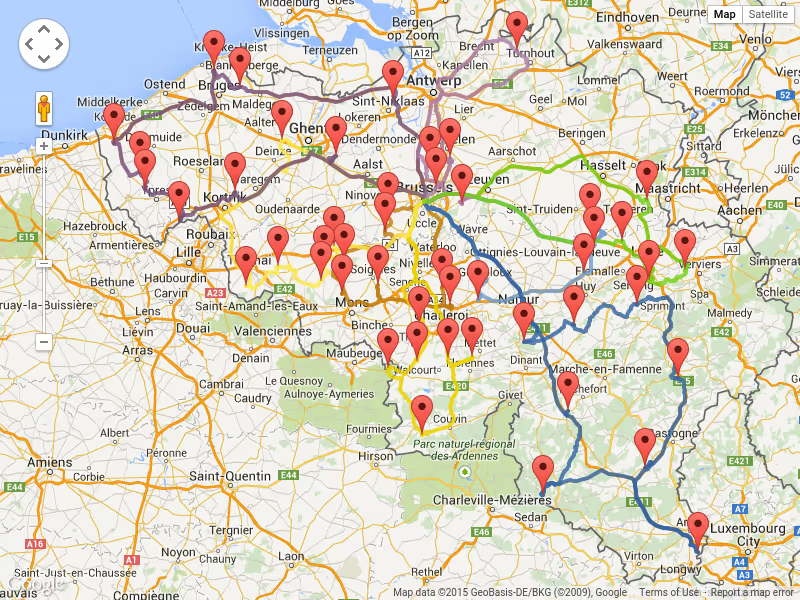
With Google Map Directions we can also visualize the actual roads used:
How fast is logging?
What’s the cost of trace/debug logging in production? What’s the performance cost of logging to a file? In these benchmarks, I compare the performance impact of logging levels (error, warn, info, debug, trace) and logging appenders (console appender, file appender) on several realistic OptaPlanner use cases.
Benchmark methodology
- Logging implementation: SFL4J
1.7.2with Logback1.0.9(Logback is the spiritual successor of Log4J 1) - Logging configuration (
logback.xml):
<?xml version="1.0" encoding="UTF-8"?>
<configuration>

  <appender name="appender" class="ch.qos.logback.core.ConsoleAppender">
    <encoder>
      <pattern>%d [%t] %-5p %m%n</pattern>
    </encoder>
  </appender>

  <logger name="org.optaplanner" level="info"/>

  <root level="warn">
    <appender-ref ref="appender"/>
  </root>

</configuration>
Which results in output like this:
2015-02-23 08:07:35,310 [main] INFO Solving started: time spent (18), best score (uninitialized/0hard/0soft), environment mode (REPRODUCIBLE), random (JDK with seed 0). 2015-02-23 08:07:35,363 [main] INFO Construction Heuristic phase (0) ended: step total (6), time spent (71), best score (0hard/-5460soft). 2015-02-23 08:07:35,641 [main] INFO Local Search phase (1) ended: step total (1), time spent (349), best score (0hard/-5460soft). 2015-02-23 08:07:35,652 [main] INFO Solving ended: time spent (360), best score (0hard/-5460soft), average calculate count per second (905), phase total (2), environment mode (REPRODUCIBLE).
- VM arguments:
-Xmx1536M -server
Software:Linux 3.2.0-59-generic-pae
Hardware:Intel® Xeon® CPU W3550 @ 3.07GHz - Each run solves 13 planning problems with OptaPlanner. Each planning problem runs for 5 minutes. It starts with a 30 second JVM warm up which is discarded.
- Solving a planning problem involves no IO (except a few milliseconds during startup to load the input). A single CPU is completely saturated. It constantly creates many short-lived objects, and the GC collects them afterwards.
- The benchmarks measure the number of scores that can be calculated per millisecond. Higher is better. Calculating a score for a proposed planning solution is non-trivial: it involves many calculations, including checking for conflicts between every entity and every other entity.
Logging levels: error, warn, info, debug and trace
I ran the same benchmark set several times with a different OptaPlanner logging level:
<logger name="org.optaplanner" level="error|warn|info|debug|trace"/>
All other libraries (including Drools) were set to warn logging. The logging verbosity of OptaPlanner differs greatly per level:
errorandwarn: 0 linesinfo: 4 lines per benchmark, so less than 1 line per minute.debug: 1 line per step, so about 1 line per second for Tabu Search and more for Late Acceptancetrace: 1 line per move, so between 1k and 120k lines per second
These are the raw benchmark numbers, measured in average score calculation count per second (higher is better):
Logging levelCloud balancing 200cCloud balancing 800cMachine reassignment B1Machine reassignment B10Course scheduling c7Course scheduling c8Exam scheduling s2Exam scheduling s3Nurse rostering m1Nurse rostering mh1Sport scheduling nl14Error66065618661192303275962828370103307121400137181248Warn66943621911226783268862978303105177182394236601278Info67393631921237343246161888299103307108394436541252Debug60254559381189173273560548062103107104390435861244Trace251592521440346206295585734792296642336031381156Dataset scale120k1920k500k250000k217k145k1705k1613k18k12k4kAlgorithmLate AcceptanceLate AcceptanceTabu SearchTabu SearchLate AcceptanceLate AcceptanceTabu SearchTabu SearchTabu SearchTabu SearchTabu Search
I’ll ignore the difference between error, warn and info logging: The difference is at most 4%, the runs are 100% reproducible and I didn’t otherwise use the computer during the benchmarking, so I presume the difference can be blamed on the JIT hotspot compiling or CPU luck.
What does turning on Debug or Trace logging cost us in performance (versus Info logging)?
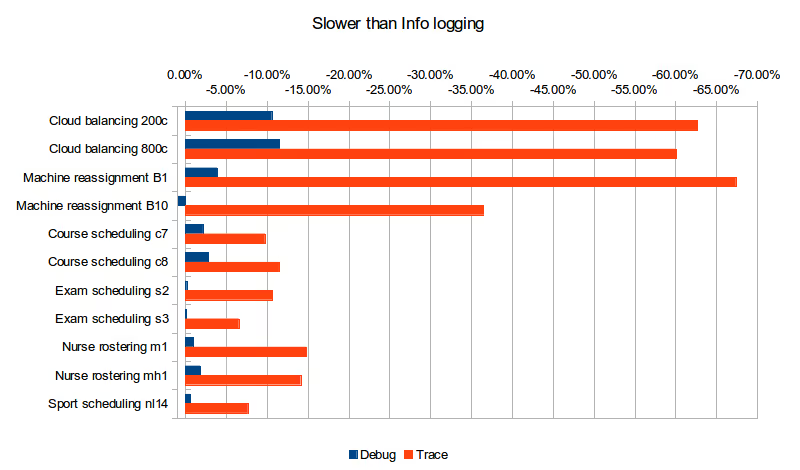
Logging levelCloud balancing 200cCloud balancing 800cMachine reassignment B1Machine reassignment B10Course scheduling c7Course scheduling c8Exam scheduling s2Exam scheduling s3Nurse rostering m1Nurse rostering mh1Sport scheduling nl14Debug-10.59%-11.48%-3.89%0.84%-2.17%-2.86%-0.19%-0.06%-1.01%-1.86%-0.64%Trace-62.67%-60.10%-67.39%-36.45%-9.74%-11.47%-10.66%-6.56%-14.81%-14.12%-7.67%Dataset scale120k1920k500k250000k217k145k1705k1613k18k12k4kAlgorithmLate AcceptanceLate AcceptanceTabu SearchTabu SearchLate AcceptanceLate AcceptanceTabu SearchTabu SearchTabu SearchTabu SearchTabu Search
Trace logging is up to almost 4 times slower! The impact of Debug logging is far less, but still clearly noticeable in many cases. The use cases that use Late Acceptance (Cloud balancing and Course scheduling), which therefore do more debug logging, seem to have a higher performance loss (although that might be in the eye of the beholder).
But wait a second! Those benchmarks use a console appender. What if they use a file appender, like in production?
Logging appenders: appending to the console or a file
On a production server, appending to the console often means losing the log information as it gets piped into /dev/null. Also during development, the IDE’s console buffer can overflow, causing the loss of log lines. One way to avoid these issues is to configure a file appender. To conserve disk space, I used a rolling file appender which compresses old log files in zip files of 5MB:
  <appender name="appender" class="ch.qos.logback.core.rolling.RollingFileAppender">
    <file>local/log/optaplanner.log</file>
    <rollingPolicy class="ch.qos.logback.core.rolling.FixedWindowRollingPolicy">
      <fileNamePattern>local/log/optaplanner.%i.log.zip</fileNamePattern>
      <minIndex>1</minIndex>
      <maxIndex>3</maxIndex>
    </rollingPolicy>
    <triggeringPolicy class="ch.qos.logback.core.rolling.SizeBasedTriggeringPolicy">
      <maxFileSize>5MB</maxFileSize>
    </triggeringPolicy>
    <encoder>
      <pattern>%d [%t] %-5p %m%n</pattern>
    </encoder>
  </appender>
These are the raw benchmark numbers, measured again in average score calculation count per second (higher is better):
Logging appender and levelCloud balancing 200cCloud balancing 800cMachine reassignment B1Machine reassignment B10Course scheduling c7Course scheduling c8Exam scheduling s2Exam scheduling s3Nurse rostering m1Nurse rostering mh1Sport scheduling nl14Console Info67393631921237343246161888299103307108394436541252File Info66497630651237583319563028338104677238402237061256Console Debug60254559381189173273560548062103107104390435861244File Debug55248522611221443122062238241104827118394535891238Console Trace251592521440346206295585734792296642336031381156File Trace10162107081252895554416516767645532278926781101
What does file appender cost us in performance (versus console appender)?
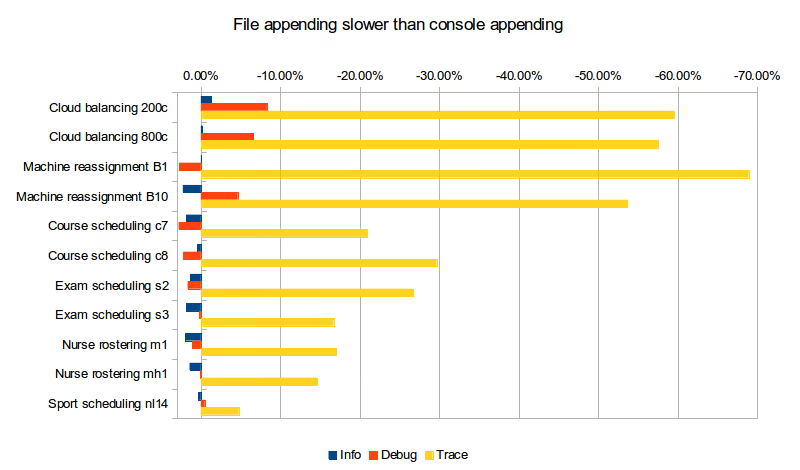
Logging levelCloud balancing 200cCloud balancing 800cMachine reassignment B1Machine reassignment B10Course scheduling c7Course scheduling c8Exam scheduling s2Exam scheduling s3Nurse rostering m1Nurse rostering mh1Sport scheduling nl14Info-1.33%-0.20%0.02%2.26%1.84%0.47%1.33%1.83%1.98%1.42%0.32%Debug-8.31%-6.57%2.71%-4.63%2.79%2.22%1.67%0.20%1.05%0.08%-0.48%Trace-59.61%-57.53%-68.95%-53.68%-20.93%-29.67%-26.71%-16.71%-16.99%-14.66%-4.76%
For info logging, it doesn’t really matter. For debug logging, there’s a noticeable slowdown for a minority of the cases. Trace logging is an extra up to almost 4 times slower! And it stacks with our previous observation: In the worst case (Machine reassignment B1), trace logging to a file is 90% slower than info logging to the console.
Conclusion
Like all diagnostic information, logging comes at a performance cost. Good libraries carefully select the logging level of each statement to balance out diagnostic needs, verbosity and performance impact.
Here’s my recommendation for OptaPlanner users: In development, use debug (or trace) logging with a console appender by default, so you can see what’s going on. In production, use warn (or info) logging with a file appender by default, so you retain important information.
Open benchmarks for the win
Recently, there was some commotion on Twitter because a competitor heavily restricts publicizing benchmarks of their Solver as part of their license. That might seem harsh, but I can understand the sentiment: when a competitor publicizes a benchmark report comparing our product against their own, I know we’re gonna get screwed. Unlike single product benchmarking, competitive benchmarking is inherently dishonest…
Competitive benchmarking for dummies
As as competitor, you can utilize several (obvious and not so obvious) means to prove your superiority over another Solver:
- Publication bias
- Pick a use case which is known to work well in your Solver.
- Use datasets with a scale and granularity which are known to work well in your Solver.
- If you’re really evil, benchmark multiple use cases and datasets in both Solvers and only retain those for which your Solver wins.
- Expertise imbalance
- Let one of your experts develop an implementations for both Solvers.
- Motivation: like any other company, your company only employs experts in your own technology.
- If he has years of recent experience in your technology, it’s unlikely he’ll had time for any recent experience in the competitive technology.
- So you’re effectively using your jockey on someone else’s horse.
- Let one of your experts develop an implementations for both Solvers.
- Tweaking imbalance
- Spend an equal amount of time on both implementations.
- The use case is probably already implemented in your Solver (or straightforward to implement), so you can spend most of the time budget to tweak it better.
- You’ll need to learn the competitor’s Solver first, so you’ll spend most of the time budget in that implementation to learn the technology, which leaves no room for tweaking.
- Spend an equal amount of time on both implementations.
- Funding
- There’s no need to explicitly set a desired outcome: your developer will know better than to bite the hand that feeds him.
Notice how these approaches don’t require any malice (except for the evil one): it’s normal to conduct a competitive benchmark like this…
Furthermore, you can make the competitive benchmark comparison look more objective, by sponsoring an academic research group to do the benchmark for you. Just make sure that’s a research group which has been happily using your technology for years and has little or no experience with the competition.
Marketing value
The marketing value of such a benchmark report should not be underestimated. These numbers, written in black and white, which clearly show the superiority of your Solver against another Solver, make a strong argument:
- To close sales deals, when in direct competition with the other Solver.
- To convince developers, researchers and students to learn and use your technology.
- To build a strong, long-term reputation.
- Benchmarks from the 90’s can still affect the Google search results today, for example for “performance of Java vs C++”.
- Such information spreads virally, and counter claims might not.
Empirical evidence
Are all competitive benchmark reports lying? Yes, they are probably misrepresenting the truth.
Should we therefore restrict users from publicizing benchmarks on our Solver? No, of course not (even if our open source licence would allow such conditions, which it does not).
Computer science - like any other science - is built on empirical evidence: the promise that any experiment I publish can be repeated by others independently. If we prevent people from publishing such repeated experiments, we undermine our science. In fact, the more people which report their benchmarks, the clearer our strengths and weaknesses show. Historically, this approach has already enabled us to diagnose and fix weaknesses, regardless whether those were caused by our Solver or the user’s domain specific implementation.
Therefore, OptaPlanner welcomes external benchmark reports. I believe in Open Science, as strongly as I believe in Open Source. I do ask the courtesy of allowing public comments/feedback on a public report website, as well as to publicize the details (such as the Solver configuration). If you use the OptaPlanner Benchmarker toolkit (which you will find convenient), simply share the benchmarker HTML report.
To run any of the benchmarks of the OptaPlanner Examples locally, simply run a *BenchmarkApp executable class, for example CloudBalancingBenchmarkApp. Notice how a small change in the *BenchmarkConfig.xml, such as switching score calculation from Easy Java to Drools or from Drools to Incremental Java, can have a serious effect in the results.
In short: I like external benchmarks, but dislike competitive benchmarks, except for …
Independent research challenges
Can we compare fairly with our competition? Yes, through an independent research challenge.
Regularly, the academic community launches such challenges. Each challenge:
- defines a real-world use case with real-world constraints
- provides multiple, real-world datasets (half of which they keep hidden)
- expects reproducible results within a specific time limit on specific hardware
- gets worldwide participation from the academic and/or enterprise Operations Research community
- benchmarks each contestant’s implementation on the same hardware in the same time limit to determine a winner
- benchmarks those hidden datasets to counter overfitting and dataset recognition
It’s fair: each jockey rides his own horse. Most of the arguments against competitive benchmarking do not apply. And as an added bonus, we get to learn from and compare with the academic research community.
In the past, OptaPlanner has done well on these challenges, despite the limited weekend time we have to spend on them. In the last challenge, the ICON power scheduling challenge, we (Lukas, Matej and me) finished in 2nd place. A minority of the researchers still beat us (with their innovative algorithms in their experimental contraptions and massive time to tweak/build those), but it’s been years since a competitive Solver has beaten us.
Long term vision
Sharing our benchmarks and enabling others to easily reproduce them, is part of a bigger vision: Too many research papers (on metaheuristics and other optimization algorithms) are hard to reproduce. That’s the paradox in computer science research: to reproduce the findings of a research paper, all we really need is a computer and the code. We don’t need an expensive laboratory. Yet, in practice, the code is usually closed and the raw benchmark data is not accessible. It’s like everyone is scared of sharing the dirty secrets of their code and their benchmarks.
I believe that we - the worldwide optimization research community - need to create a benchmark repository: a centralized repository of benchmarks for every use case, for every dataset, for every algorithm, for every implementation version, for any amount of running time. That, together with a good statistical interface, will give us some real insight as to which optimization algorithms are good under which circumstances.
We - in OptaPlanner - are well on our way to build exactly that:
- OptaPlanner Examples already implements 14 distinct use cases.
- For each use case, we’re already benchmarking on many different optimization algorithms.
- Our benchmarker HTML report already includes many useful statistics to analyse the raw benchmark data.
Vehicle routing with real road distances
In the real world, vehicles in a Vehicle Routing Problem (VRP) have to follow the roads: they can’t travel in a straight line from customer to customer. Most VRP research papers and demos happily ignore this implementation detail. As did I, in the past. Although using road distances (instead of air distances) doesn’t impact the NP-hard nature of a VRP much, it does result in a few extra challenges. Let’s take a look at those challenges.
Datasets with road distances
First off, we need realistic datasets. Unfortunately, public VRP datasets with road distances are scarce in the VRP research community. The VRP Web has few small ones, such as a dataset of Bavaria with 29 locations, but nothing serious. So I had to generate some realistic datasets myself with the following requirements:
- Use Google Maps like roads with real distances in
kmbetween every pair of locations in the dataset.- For example, use highways when reasonable over small roads.
- For every dataset, generate an air distance variant and a road distance variant, to compare results.
- Generate a similar dataset in multiple orders of magnitude, to compare scalability.
- Add reasonable vehicle capacities and customer demands, for the vehicle capacity constraint in VRP.
I ended up generating datasets of Belgium with a location for cities, towns and subtowns. The biggest one has 2750 locations. I might add a road variant of the USA datasets later, those go up to 100 000 locations.
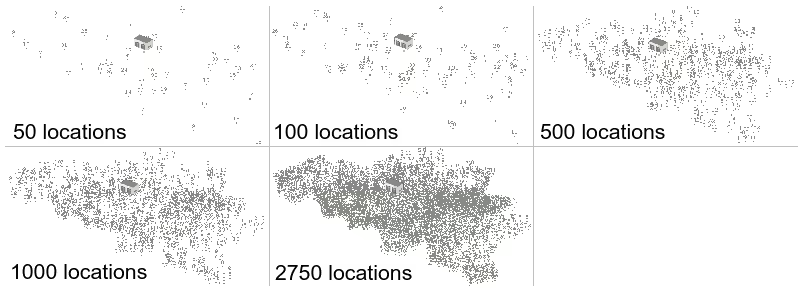
By using the excellent Java library GraphHopper, based on OpenStreetMap, querying practical road distances was relatively easy. It’s also fast, as long as the entire road network (only 200MB for Belgium) can be loaded into memory. Loading the entire road network of North-America (6GB) is a bit more challenging. I’ll submit these datasets to the VRP Web, so others researchers can use them too.
All this happens before OptaPlanner's VRP example starts solving it. During solving, the distances are already available in a lookup table. Once we start generating datasets with 1000 locations or more, pre-calculating all distances between every location pair can introduce memory and performance issues. I’ll explain those and the remedies in my next blog.
Air distance vs Road distance
For clarity, I’ll focus on the dataset belgium-n50-k10.vrp which has 50 locations and 10 vehicles with capacity 125 each. OptaPlanner was given 5 minutes to solve both variants (air and road distance).
Using air distances (which calculates the euclidean distance based on latitude and longitude) results in:
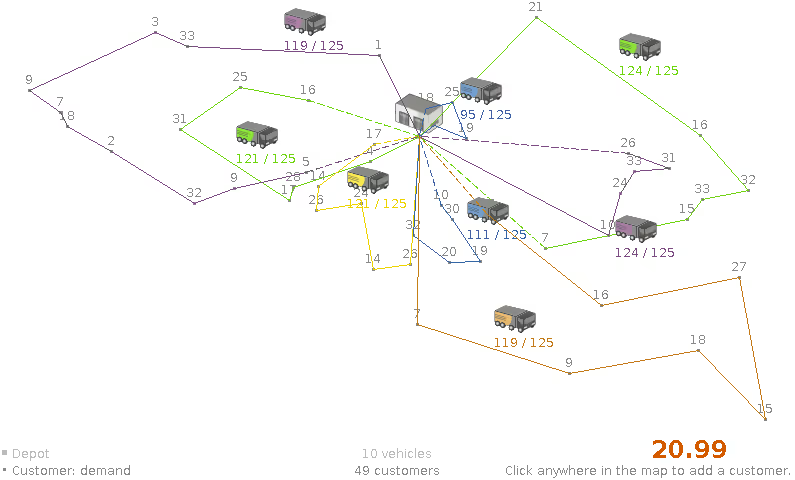
The total distance, 22.99 doesn’t mean much because it’s not in a common unit of measurement and because our vehicles can’t fly from point to point anyway. We need to apply this air distance solution on the real road network (shown below), to know the real distance:
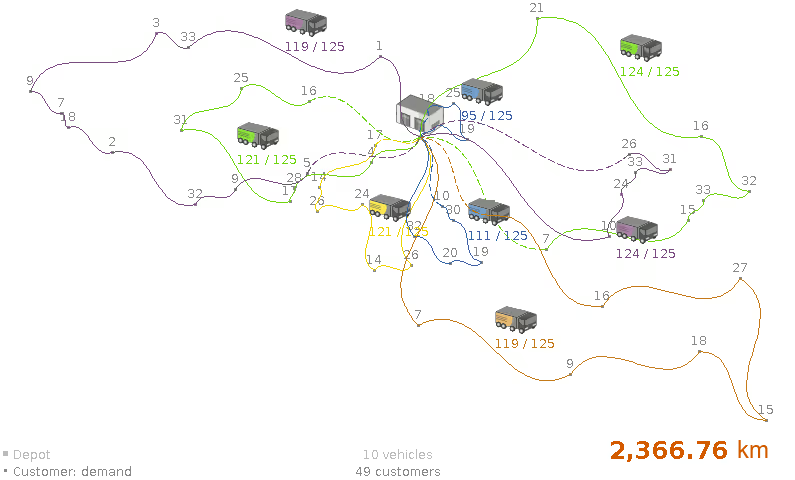
Now, let’s compare that air distance solution above with the road distance solution below.
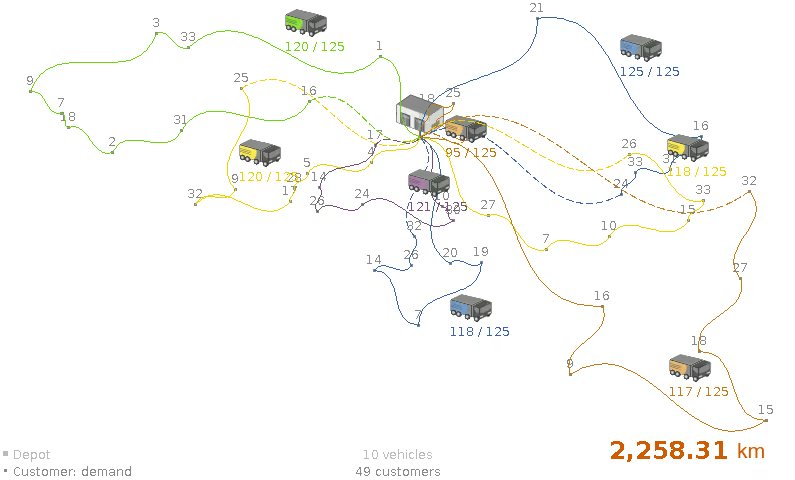
The road distance solution takes 108.45 km less, so it’s almost 5% better! And that’s on one of the most dense road networks in the world (Belgium’s road network): on more sparse road networks the gain might be more.
Conclusion
Using real distances instead of air distances does matter. Solving an VRP with air distances and then apply road distances is suboptimal.
Cheating on the N Queens benchmark
Many Solver distributions include an N Queens example, in which n queens need to be placed on a n*n sized chessboard, with no attack opportunities. So when you’re looking for the fastest Solver, it’s tempting to use the N Queens example as a benchmark to compare those solvers. That’s a tragic mistake, because the N Queens problem is solvable in polynomial time, which means there’s a way to cheat.
That being said, OptaPlanner solves the 1 000 000 queens problem in less than 3 seconds :) Here’s a log to prove it (with time spent in milliseconds):
INFO Opened: data/nqueens/unsolved/10000queens.xml INFO Solving ended: time spent (23), best score (0), ...INFO Opened: data/nqueens/unsolved/100000queens.xml INFO Solving ended: time spent (159), best score (0), ...INFO Opened: data/nqueens/unsolved/1000000queens.xml INFO Solving ended: time spent (2981), best score (0), ...
How to cheat on the N Queens problem
The N Queens problem is not NP-complete, nor NP-hard. That is math speak for stating that there’s a perfect algorithm to solve this problem: the Explicits Solutions algorithm. Implemented with a CustomPhaseCommand in OptaPlanner it looks like this:
public class CheatingNQueensPhaseCommand implements CustomPhaseCommand {

    public void changeWorkingSolution(ScoreDirector scoreDirector) {
        NQueens nQueens = (NQueens) scoreDirector.getWorkingSolution();
        int n = nQueens.getN();
        List<Queen> queenList = nQueens.getQueenList();
        List<Row> rowList = nQueens.getRowList();

        if (n % 2 == 1) {
            Queen a = queenList.get(n - 1);
            scoreDirector.beforeVariableChanged(a, "row");
            a.setRow(rowList.get(n - 1));
            scoreDirector.afterVariableChanged(a, "row");
            n--;
        }
        int halfN = n / 2;
        if (n % 6 != 2) {
            for (int i = 0; i < halfN; i++) {
                Queen a = queenList.get(i);
                scoreDirector.beforeVariableChanged(a, "row");
                a.setRow(rowList.get((2 * i) + 1));
                scoreDirector.afterVariableChanged(a, "row");

                Queen b = queenList.get(halfN + i);
                scoreDirector.beforeVariableChanged(b, "row");
                b.setRow(rowList.get(2 * i));
                scoreDirector.afterVariableChanged(b, "row");
            }
        } else {
            for (int i = 0; i < halfN; i++) {
                Queen a = queenList.get(i);
                scoreDirector.beforeVariableChanged(a, "row");
                a.setRow(rowList.get((halfN + (2 * i) - 1) % n));
                scoreDirector.afterVariableChanged(a, "row");

                Queen b = queenList.get(n - i - 1);
                scoreDirector.beforeVariableChanged(b, "row");
                b.setRow(rowList.get(n - 1 - ((halfN + (2 * i) - 1) % n)));
                scoreDirector.afterVariableChanged(b, "row");
            }
        }

    }

}
Now, one could argue that this implementation doesn’t use any of OptaPlanner’s algorithms (such as the Construction Heuristics or Local Search). But it’s straightforward to mimic this approach in a Construction Heuristic (or even a Local Search). So, in a benchmark, any Solver which simulates that approach the most, is guaranteed to win when scaling out.
Why doesn’t that work for other planning problems?
This algorithm is perfect for N Queens, so why don’t we use a perfect algorithm on other planning problems? Well, simply because there are none!
Most planning problems, such as vehicle routing, employee rostering, cloud optimization, bin packing, …are proven to be NP-complete (or NP-hard). This means that these problems are in essence the same: a perfect algorithm for one, would work for all of them. But no human has ever found such an algorithm (and most experts believe no such algorithm exists).
Note: There are a few notable exceptions of planning problems that are not NP-complete, nor NP-hard. For example, finding the shortest distance between 2 points can be solved in polynomial time with A*-Search. But their scope is narrow: finding the shortest distance to visit n points (TSP), on the other hand, is not solvable in polynomial time.
Because N Queens differs intrinsically from real planning problems, it is a terrible use case to benchmark.
Conclusion
Benchmarks on the N Queens problem are meaningless. Instead, benchmark implementations of a realistic competition. A realistic competition is an official, independent competition:
- that clearly defines a real-word use case
- with real-world constraints
- with multiple, real-world datasets
- that expects reproducible results within a specific time limit on specific hardware
- that has had serious participation from the academic and/or enterprise Operations Research community
Can MapReduce solve planning problems?
To solve a planning or optimization problem, some solvers tend to scale out poorly: As the problem has more variables and more constraints, they use a lot more RAM memory and CPU power. They can hit hardware memory limits at a few thousand variables and few million constraint matches. One way their users typically work around such hardware limits, is to use MapReduce. Let’s see what happens if we MapReduce a planning problem, such as the Traveling Salesman Problem.
About MapReduce
MapReduce is programming model which has proven to be very effective to run a query on big data. Generally speaking, it works like this:
- The data is partitioned across multiple computer nodes.
- A map function runs on every partition and returns a result.
- A reduce function reduces 2 results into one result. It’s continuously run until only a single result remains.
For example, suppose we need to find the most expensive invoice record in a data cluster:
- The invoice records are partitioned across multiple computer nodes.
- For each node, the map function extracts the most expensive invoice for that node.
- The reduce function takes 2 invoices and returns the most expensive.
About the Traveling Salesman Problem
The Traveling Salesman Problem (TSP) is a very basic planning problem. Given a list of cities, find the shortest path to visit all cities.
For example, here’s a dataset with 68 cities and its optimal tour with a distance of 674:
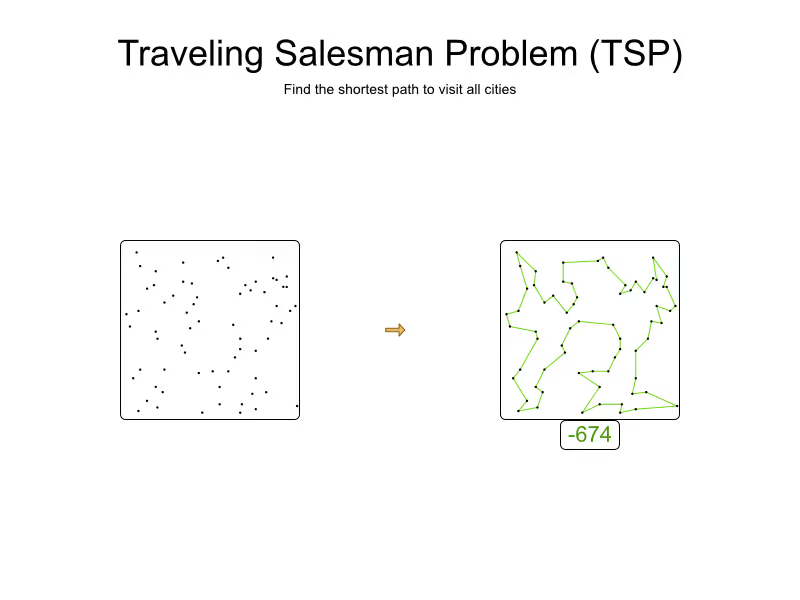
The search space of this small dataset has 68! (= 1096) combinations. That’s a lot.
A more realistic planning problem, such vehicle routing, has more constraints (both in number as in complexity), such as: vehicle capacity, vehicle type limitations, time windows, driver limits, etc.
MapReduce on TSP
Even though most solvers probably won’t go out of memory on only 68 variables, the small size of this problem allows us to visualize it clearly:
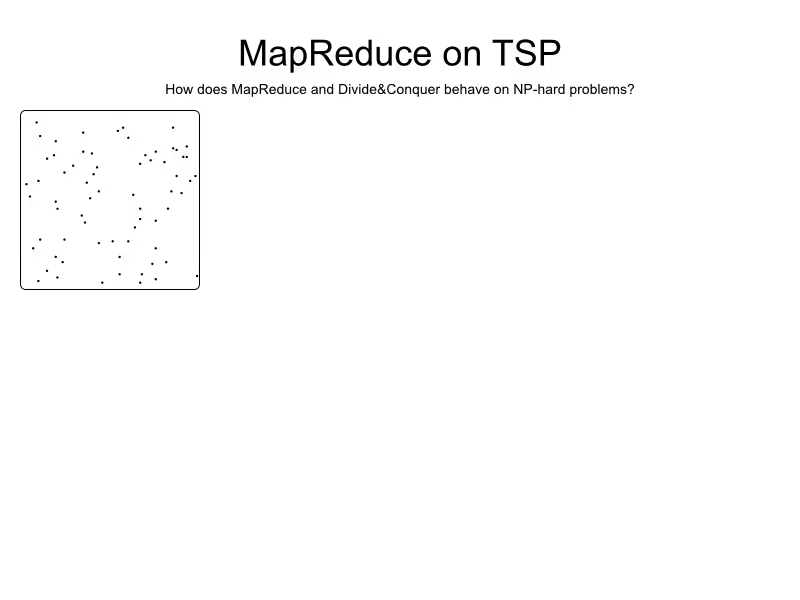
Let’s apply MapReduce on it:
1) Partition: Divide the problem into n pieces
First, we take the problem and split it into n pieces. Usually, n is the number of computer nodes in our system. For visual reasons, we divide it into only 4 pieces:
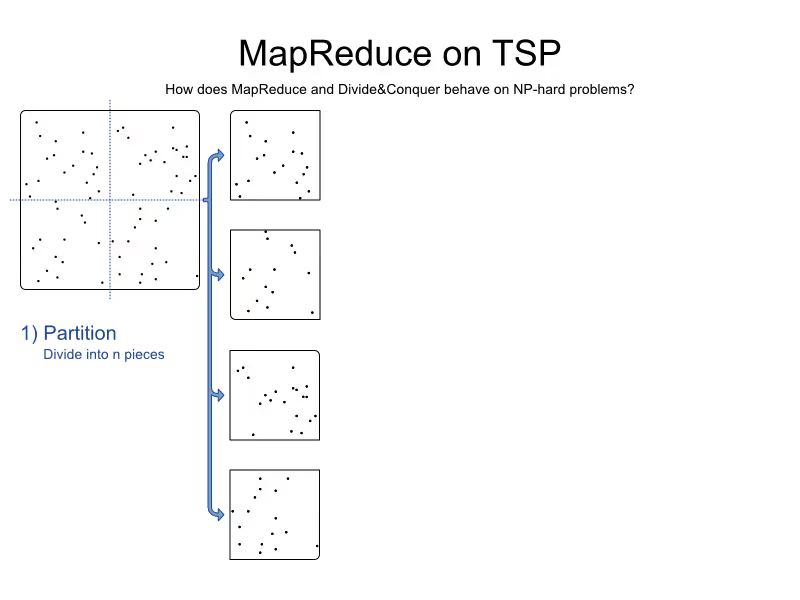
TSP is easily partitioned because of it only has 1 relevant constraint: find the shortest path.
In a more realistic planning problem, sane partitioning can be hard or even impossible. For example:
- In capacitated vehicle routing, no 2 partitions should share the same vehicle. What if we have more partitions than vehicles?
- In vehicle routing with time windows, each partition should have enough vehicle time to service each customer and drive to each location. Catch 22: How do we determine the drive time if we don’t know the vehicle routes yet?
It’s tempting to make false assumptions.
2) Map: Solve each piece separately
Solve each partition using a Solver:
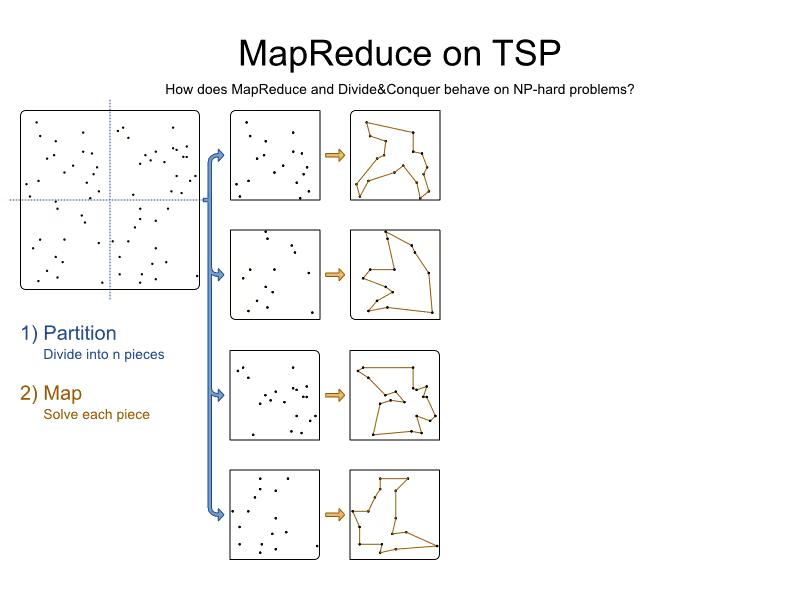
We get 4 pieces, each with a partial solution.
3) Reduce: Merge solution pieces
Merge the pieces together. To merge 2 pieces together, we remove an arc from each piece and add 2 arcs to connect cities of different pieces:
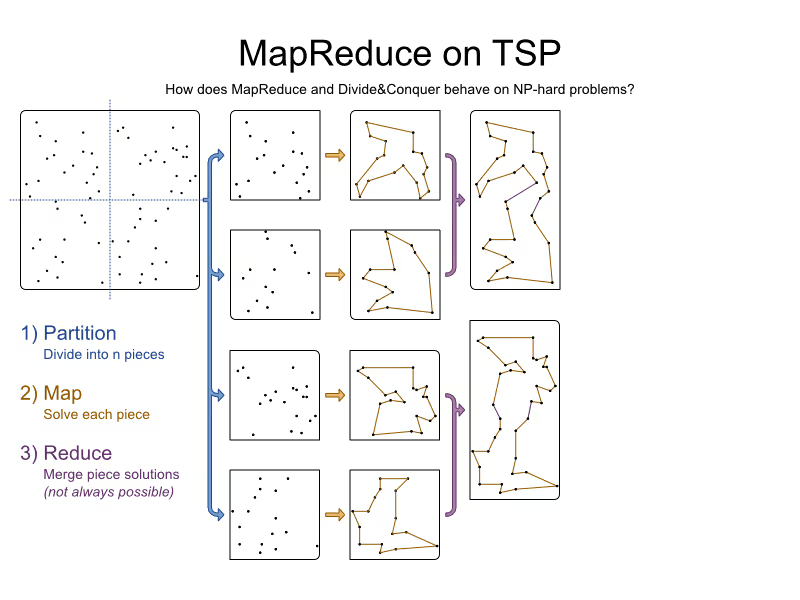
We do merge several times until all pieces are merged:
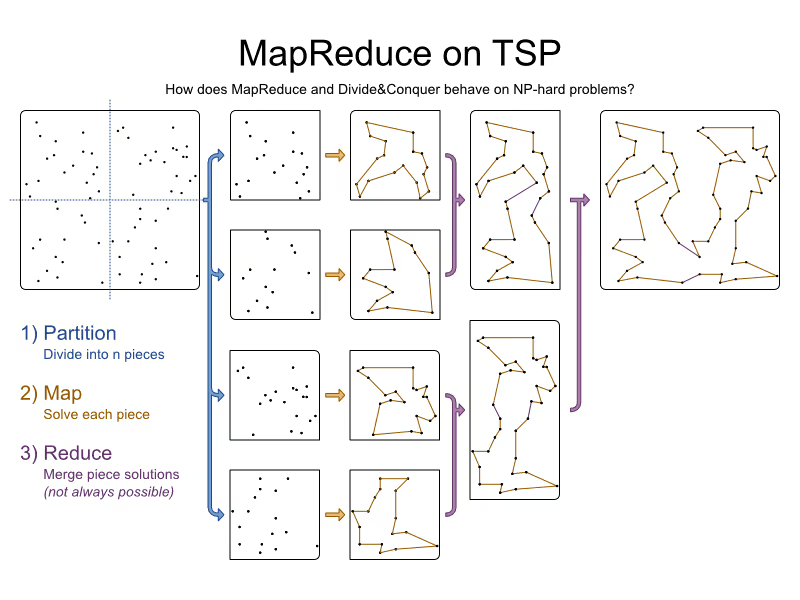
There are several ways to merge 2 pieces together. Here we try every combination and take the optimal one. For performance reasons, we might instead connect the 2 closest cities of different pieces with an arc, and then add a correcting arc on the other side (however long that may be).
In a more realistic planning problem, with more complex constraints, merging feasible partial solutions often results into an infeasible solution (with broken hard constraints). Smarter partitioning, which takes all the hard constraints into account, can sometimes solve this…at the expense of more broken soft constraints and a higher maintenance cost.
4) Result: What is the quality of the result?
Each piece was solved optimally. Pieces were merged optimally. But the result is not optimal:
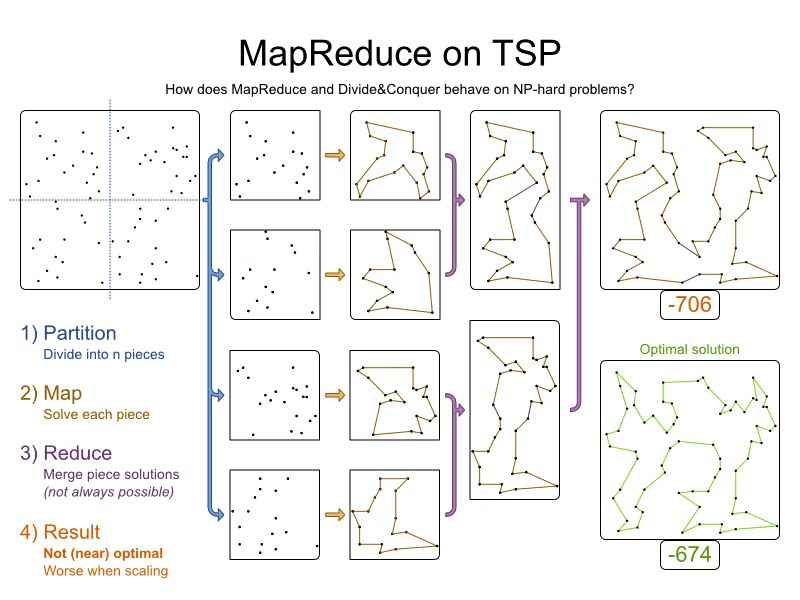
In fact, the results aren’t even near optimal, especially as we scale out with a MapReduce approach:
- More variables result in a lower result quality.
- More constraints result in a lower result quality, presuming it’s even possible to partition and reduce sanely.
- More partitions result in a lower result quality.
Conclusion
MapReduce is great approach to handle a query problem (and presumably many other problems). But MapReduce is a terrible approach on a planning or optimization problem. Use the right tool for the job.
Note: We applied MapReduce on the planning problem, not on the optimization algorithm implementation in a Solver, for which it can make sense. For example, in a depth-first search algorithm, MapReduce can make sense to explore the search tree (although the search tree scales exponentially bad which dwarfs any gain of MapReduce).
To solve a big planning problem, use a Solver (such as OptaPlanner, now continued as Timefold) that scales well in memory, so you don’t need to resort to partitioning at the expense of solution quality.

When scheduling works, everything works.
Less waste. More control. Teams that trust the plan.